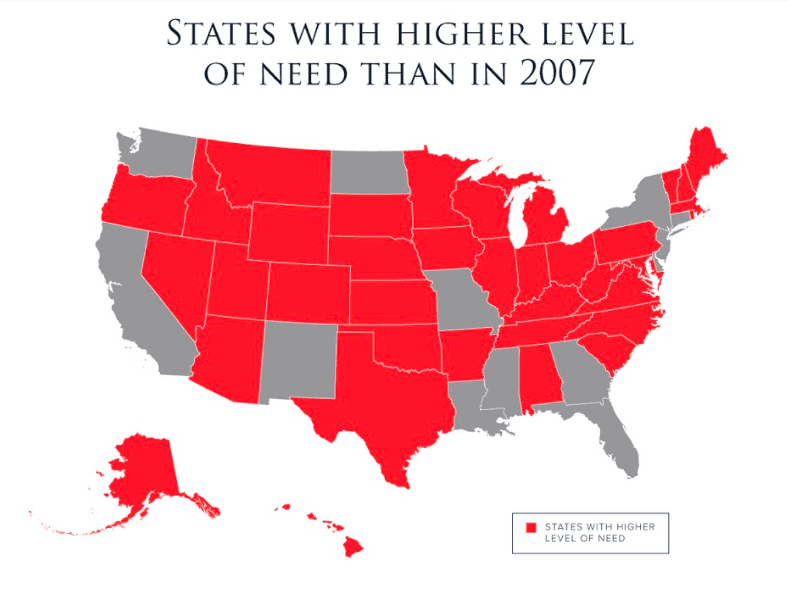
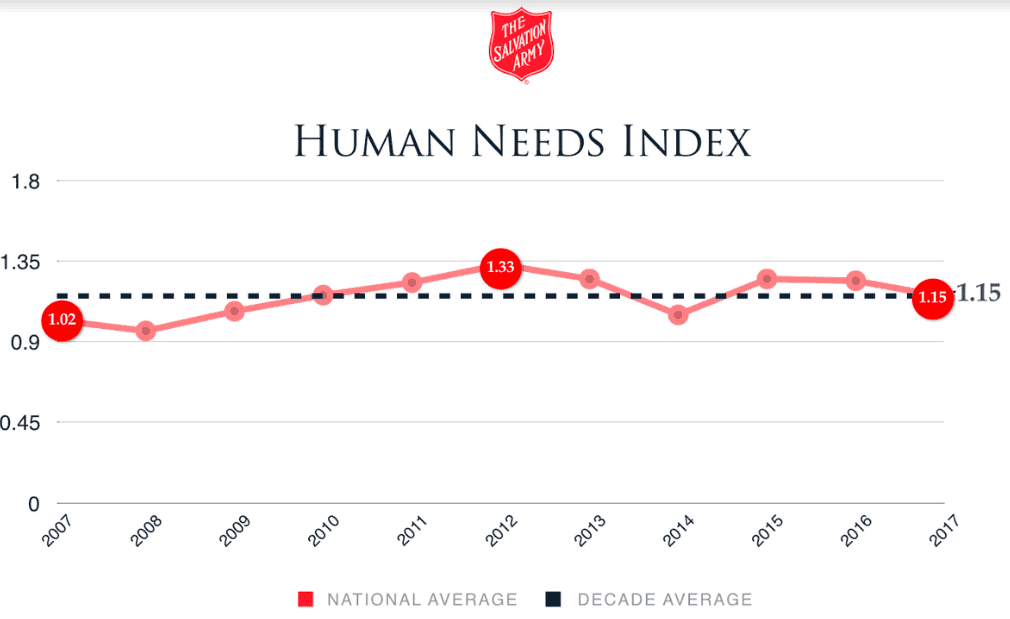
The just-released edition of the Human Needs Index (HNI) reveals that despite an improving national economy, in many places American need is still greater than it was before the Great Recession. According to the HNI, only 13 states have a lower level of need in 2017 than in 2007.
A joint partnership between The Salvation Army and the Indiana University Lilly Family School of Philanthropy at IUPUI, the HNI is the only multidimensional measure of human need based on objective data from a social services provider serving on the front lines of poverty. The Salvation Army serves nearly 25 million people a year, in every ZIP code in America.
The scale of the HNI begins at 0—indicating a minimum level of need. The higher the HNI value, the greater the need.
The national HNI began trending upward in 2007 at the start of the Great Recession, hitting its peak in 2012. Since then, the national HNI has generally been declining gradually, with one notable exception in 2014 when the value fell below the decade average (2007-2017).
“The Human Needs Index shows overall improvement, but it will take more time for many people in specific regions of the country who are in need to fully recover from the Great Recession,” said Dr. Una Osili, an economist who is associate dean for research and international programs at the Lilly Family School of Philanthropy. “The data suggest that in many states, people are continuing to experience a need for various types of assistance.”
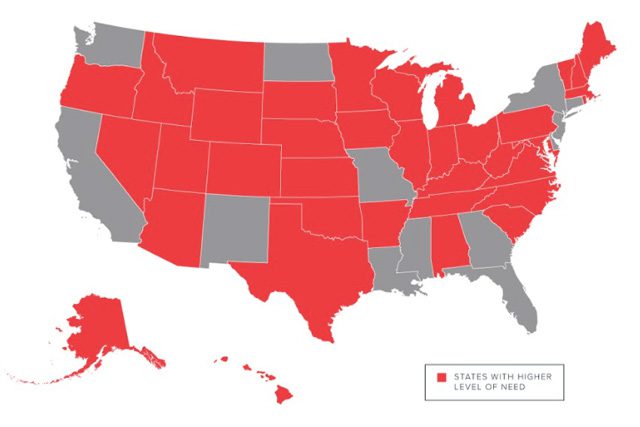
Almost three-quarters of states show higher levels of need in 2017 compared to 2007. In 16 states, HNI values have grown more than 100 percent. Arkansas, whose HNI was lower than the national average in 2007 (.38), has grown 677 percent to 2.94, ranking third in 2017 for level of need.
The level of need in Nevada, the District of Columbia, Kansas and California has been higher than the national average every year in the past decade. Michigan was below the national average only at the beginning of the Great Recession in 2007.
A closer look at these four states and the District of Columbia in 2017 tells us:
- Nevada (4.76) has had the highest HNI values for the past two years. Nevada has ranked among the 10 states with the highest level of need in every year for the last 10 years.
- More than one in five residents of the District of Columbia (1.34) live below the poverty level, according to the U.S. Census Bureau. Also, soaring housing costs have contributed to a homelessness rate that is double the national average.
- In the past few years, lawmakers in Kansas (1.58) have instituted significant safety net reforms; for example, reductions to Temporary Aid for Needy Families (TANF).
- Michigan (1.53) remains a tale of two states. Some areas have seen improved economic conditions. However, other areas of the state, like Detroit and Flint, still have high unemployment rates relative to the rest of the nation.
- California (1.18) is home to a quarter of the homeless population in the U.S., according to the Department of Housing and Urban Development. This is driven, in part, by a shortage of affordable housing in the state’s major cities.
Unlike traditional government measures that track poverty by income figures and labor statistics, the HNI measures need for basic human services with different indicators and less lag time. Since its inception in 2015, the HNI has served as a powerful tool for understanding the poor in an evolving economy.
“Every day, The Salvation Army sees firsthand how the nation’s economic recovery has bypassed many Americans across the U.S.,” said Commissioner David Hudson, national commander of The Salvation Army. “We hope our ground-level insights can help policymakers and other social service providers work more creatively and collaboratively to assist those still struggling to break out of poverty.”
See more at humanneedsindex.org.
